
How to Find the Best Time to Post for Your Account
· 11 min read · by Jan Oršula
To find your own best time to post, start with the activity chart in your platform's analytics (Instagram's "Most active times", TikTok Studio's follower activity, YouTube's "When your viewers are on YouTube"), pick two or three candidate slots from it, then post the same kind of content in each slot on rotation for four weeks. Compare the median reach per post by slot, and keep the winner. The chart gives you candidates. Only the test tells you which one works for your account.
That second step is the one most advice skips, and it matters because the busiest hour on the chart often isn't the best one. This guide covers where each platform shows your audience's active hours, the three reasons that chart misleads, and a slot test you can run with a spreadsheet, including a worked example.
If you have no data yet (a new account, or under 100 followers), take your starting slots from our best time to post heatmap and come back here once you've posted for a few weeks.
Where each platform shows when your audience is online
Every major platform reports some version of "when your followers use the app". The names and menus shift between app versions, so if a label below doesn't match your screen, look in the audience or followers section of the analytics.
Instagram: "Most active times"
You need a professional account (Creator or Business). Switching from a personal account is free, takes a minute in settings under account type, and is the only way to see this data; a personal account has no insights at all, which answers the common "best time to post on Instagram for my personal account" question.
Open your profile, tap Professional dashboard, open your account insights and go to Total followers. Scroll down to Most active times, which has an hours view and a days view. Instagram only shows follower trends once you have at least 100 followers.
Look at the days view first. Most accounts see a fairly flat week, and the real differences are in the hours. If you manage Instagram from a desktop, Meta Business Suite's insights carry the same audience data.
TikTok: follower activity in TikTok Studio
Go to your profile, open the menu, choose TikTok Studio, then Analytics and View all. The activity chart sits under Followers (some app versions show a "most active times" view under Viewers instead). It breaks activity down by hour and by day.
One detail catches people out: TikTok shows follower activity in your local time zone but most of its other analytics in UTC. When you line up a post's performance against the activity chart, check you're comparing the same clock.
YouTube: "When your viewers are on YouTube"
In YouTube Studio, open Analytics, then the Audience tab. The When your viewers are on YouTube report is a heatmap of when your viewers were on YouTube over the last 28 days. Small channels may not see it until there's enough viewing data.
YouTube is the platform where posting time matters least for long videos, because search and suggested traffic keep arriving for months. Treat the heatmap as a guide for Shorts, premieres and anything time-sensitive, where the first hours count.
Facebook and Meta Business Suite
Facebook's hourly "when your fans are online" chart has moved around Page Insights and Meta Business Suite over the years, and some Pages no longer see it. Check Insights in Meta Business Suite for an activity or audience view first. If there isn't one, sort your posts in Insights by reach and note the publish day and hour of the top and bottom ten. That list is rougher than a chart, but it describes your actual posts.
LinkedIn, Pinterest, X and Threads
These give you little or nothing on hours. LinkedIn's analytics for personal profiles show follower demographics and per-post numbers, not an activity chart, so use the follower locations to work out which time zone your audience lives in and test from there. Pinterest's analytics cover audience interests and demographics, and since Pins keep getting found for weeks, the hour you publish matters much less there than on TikTok or Reels. X and Threads have no native activity chart. On all four, the slot test below is the method.
Why "followers online" isn't the same as "best time"
The activity chart answers one narrow question: when do the people who already follow you open the app? Your best posting time depends on more than that, for three reasons.
Most short-form views don't come from followers
On TikTok, and increasingly on Instagram Reels, the For You and recommendation feeds show your video to people who don't follow you. A follower chart describes a slice of the audience that matters less every year on those surfaces. A Reel can find most of its viewers among non-followers in a different time zone, at an hour your chart calls quiet. On follower-led surfaces (Instagram feed posts and Stories, Facebook Pages, LinkedIn), the chart is a better guide.
The peak is also when everyone else posts
When your followers are online, so are the accounts they follow, and many of those accounts read the same chart. A post at the busiest hour competes with the most new posts for the first wave of attention. A slot an hour or two before the peak gives the post time to gather early engagement, then rides the peak while it's still fresh. That's why "post just before your peak" is a better first guess than "post at your peak".
The chart can't score a slot you've never tried
Your post-level data only covers the hours you actually posted. If you've posted at 9 a.m. for a year, your best-performing posts were all posted at 9 a.m., and that tells you nothing about 7 p.m. Habits pass for results this way. The only fix is to deliberately post in slots you haven't been using, which is what the test does.
Kadenzo Professional
Suggested times worked out from your own posts
Kadenzo scores each account's past posts and marks its strongest slots as personalized in the composer. On the Professional plan, from $29 a month.
The four-week slot test
This is posting-time testing in its simplest form. If you want the reasoning behind sample sizes and why single posts mislead, our guide to honest social media A/B testing goes deeper; here is the version for timing.
1. Pick two or three candidate slots
Take them from your activity chart: one at or just before the peak, one in a secondary bump, and one wildcard you've never tried (often the evening on TikTok and Reels, early morning on LinkedIn). Three slots is the maximum at three posts a week. If you post less than three times a week, test two.
2. Rotate the slots so each one gets every day
Don't give each slot its own day, or you'll end up testing Monday against Friday. Rotate instead, so each slot lands on each posting day across the four weeks:
| Monday | Wednesday | Friday | |
|---|---|---|---|
| Week 1 | Slot A | Slot B | Slot C |
| Week 2 | Slot B | Slot C | Slot A |
| Week 3 | Slot C | Slot A | Slot B |
| Week 4 | Slot A | Slot B | Slot C |
That gives each slot four posts. Four is the minimum that tells you anything; if you can stretch to six or eight weeks, the answer gets a lot more trustworthy.
3. Hold everything else steady
Same format in every slot (all Reels, or all carousels, not a mix), the same kind of topics, no paid boosts, no collabs, and your usual posting frequency. If one post goes out with a giveaway or a trending sound the others didn't have, note it in the sheet. Keep it in the data, but mark it.
4. Measure reach at the same age
Pick one metric before you start. Reach per post (views for TikTok, Reels and Shorts) is the cleanest for timing, because posting time mostly decides who sees the first hours. Engagement rate works too, as long as you calculate it the same way every time. Record it at a fixed age, such as 7 days after posting, because a post from Monday has had more time to collect views than one from Friday when you check on Sunday.
5. Compare medians, not averages
Use the median reach per slot. One post that takes off can drag an average so far that it crowns the wrong slot, while a median shrugs it off. Then apply a simple rule: call a winner only if its median beats the runner-up by about 20% and it won in at least three of the four weeks. Anything closer is a tie, which is useful too. It means time isn't your problem, so spend the effort on hooks and formats instead.
A worked example (hypothetical numbers)
Here is how a test might read for an Instagram account that posts three Reels a week. The numbers are made up to show the method; they aren't from a real account or a study.
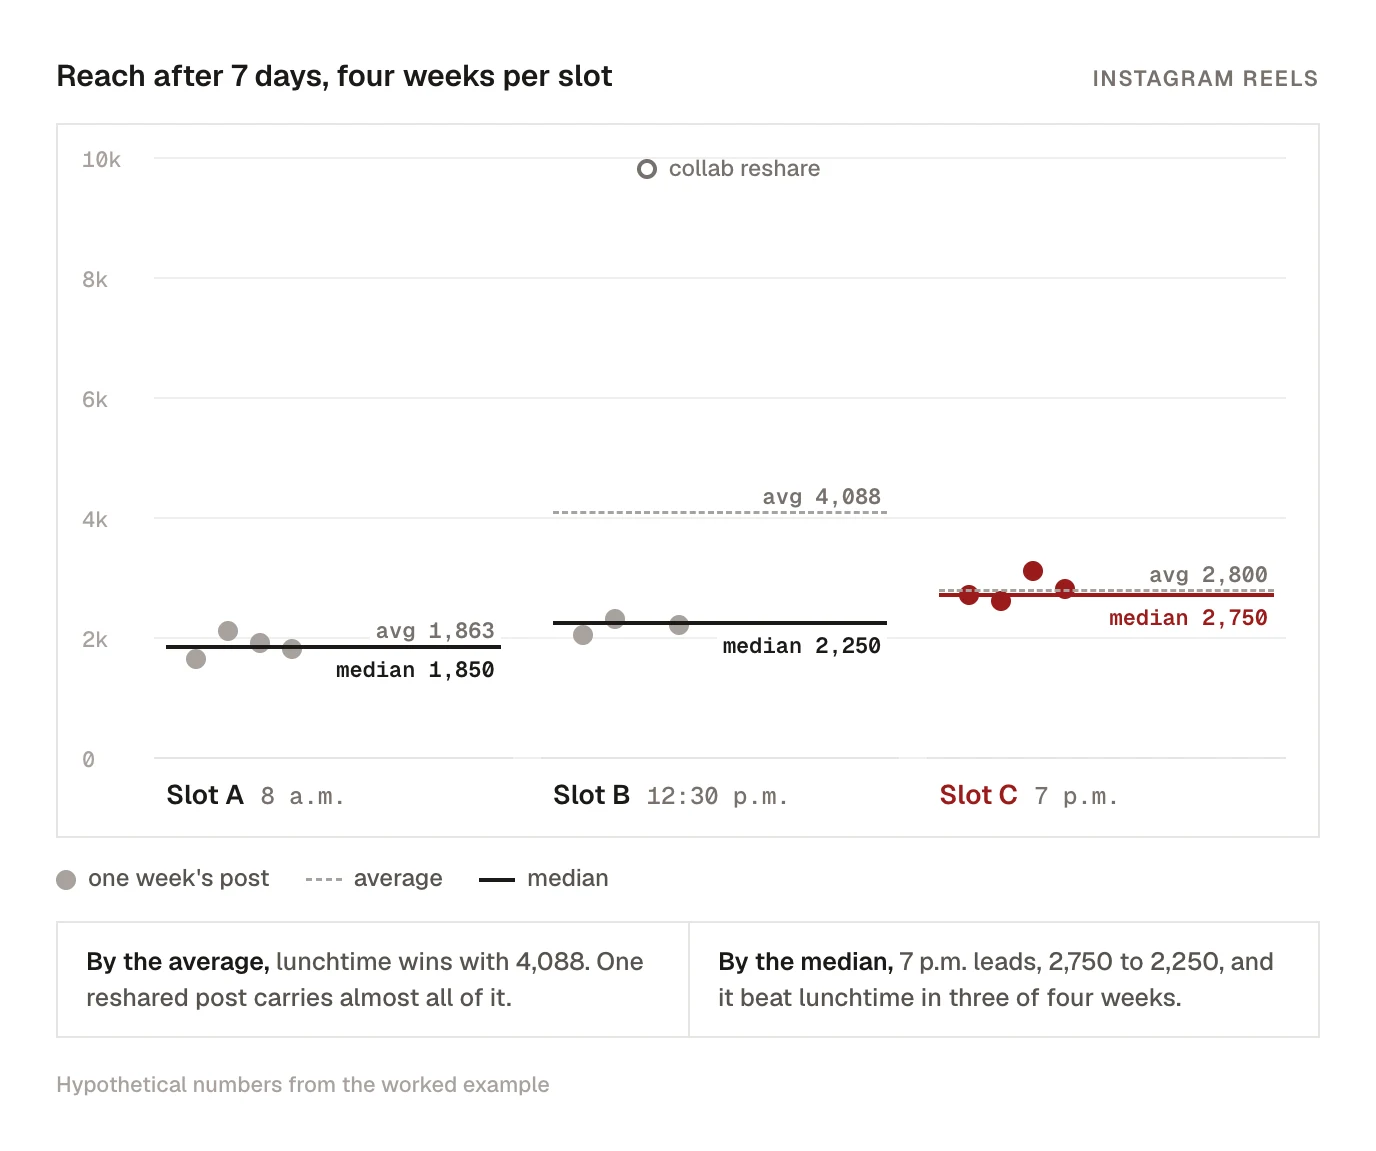
The Most active times chart peaks at 12 p.m., so the three slots are A: 8 a.m., B: 12:30 p.m. (the peak) and C: 7 p.m. (a smaller evening bump). Reach is recorded 7 days after each post:
| Slot A, 8 a.m. | Slot B, 12:30 p.m. | Slot C, 7 p.m. | |
|---|---|---|---|
| Week 1 | 1,650 | 2,050 | 2,700 |
| Week 2 | 2,100 | 2,300 | 2,600 |
| Week 3 | 1,900 | 9,800 (a collab reshared it) | 3,100 |
| Week 4 | 1,800 | 2,200 | 2,800 |
| Average | 1,863 | 4,088 | 2,800 |
| Median | 1,850 | 2,250 | 2,750 |
By the average, the lunchtime peak wins easily. But almost all of that lead comes from one post that a bigger account reshared, which had nothing to do with the hour. By the median, the evening slot leads: 2,750 against 2,250 is 22% ahead, and it beat the lunchtime slot in weeks 1, 2 and 4. That passes the rule, so 7 p.m. becomes the default.
The next cycle keeps 7 p.m. as the control, drops 8 a.m., and tests a new challenger such as 9 p.m. or 5 p.m. against it for another four weeks. Two or three cycles, and you have a posting time that came from your own audience. Re-run one cycle each quarter, because audiences drift as an account grows and seasons change.
Time zones in one paragraph
All of this assumes your audience mostly lives in one or two time zones. Check follower locations in the same analytics, and if a big share sits several hours away from you, run the test in their local time, not yours. Our guide to scheduling across time zones covers the region windows and the daylight-saving shift that quietly moves your slots twice a year.
Let the scheduler keep the score
The test above works with a spreadsheet. Once it has given you a winning slot, a scheduler stops you sliding back into posting whenever you happen to finish the edit.
Kadenzo, the scheduler we make, does part of the scoring for you on the Professional plan and up. For each connected Instagram, Facebook, TikTok, Threads, Bluesky and Pinterest account with at least 20 posts in its recent history (roughly the last six months), it builds a weekly grid from the engagement on your own posts. Each post is scored against the account's typical post, and capped, so one viral post can't claim a slot on its own. That grid is blended with the platform research data behind our heatmap, and your own history gets more weight as it grows, up to 70% once there are about 60 posts. The composer then suggests times marked "personalized". On Starter, and for X, YouTube and LinkedIn, the suggestions come from the research data alone.
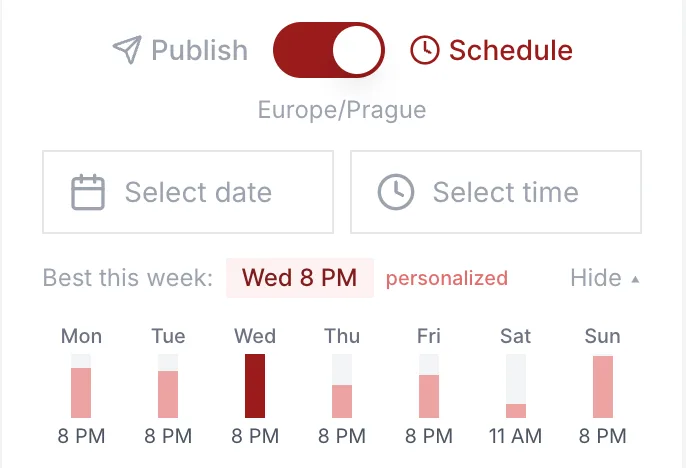
The same honest caveat applies to it as to your own chart: it can only learn from hours you've posted in. So run the slot test first, and let the suggestions tell you when a habit has started to slip.
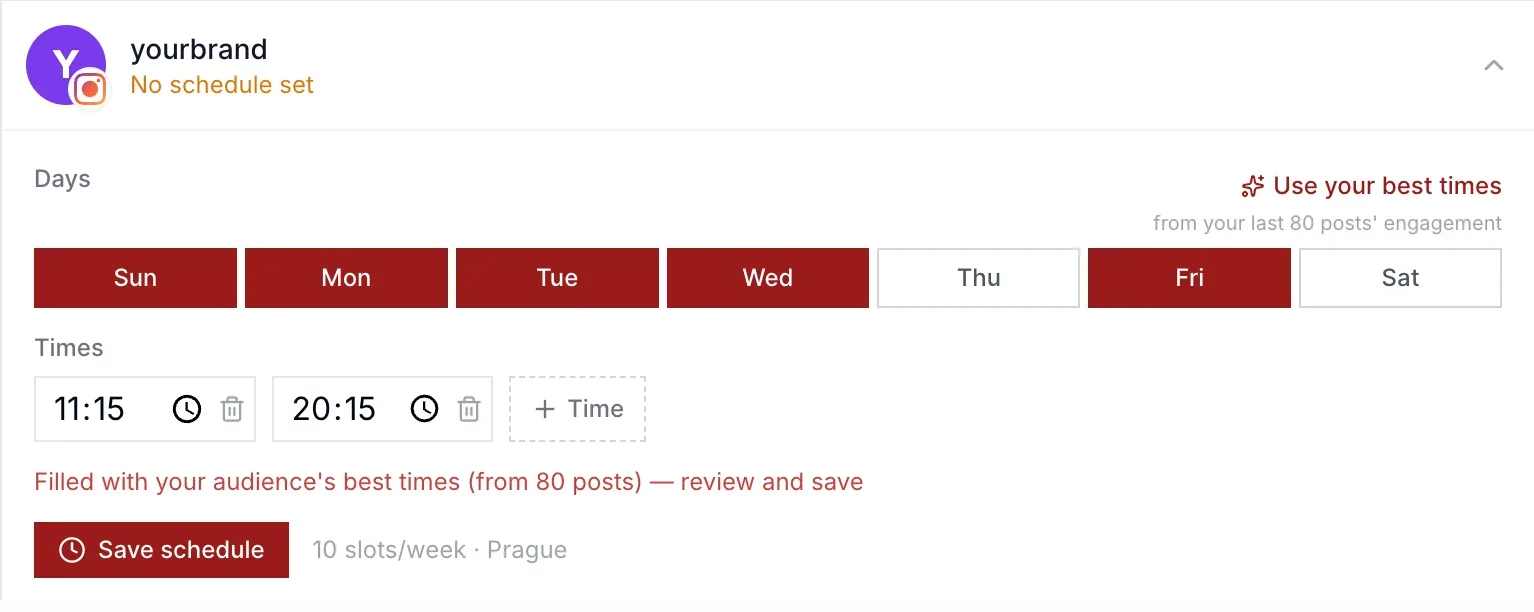
If you post on a fixed rhythm, the posting queue (Professional and up) saves you picking a time at all. You set days and times per account, and Use your best times fills them from that account's engagement history, or Suggest times fills them from research data when there isn't enough history yet. You add posts to the queue and each one goes out in the next open slot.
Kadenzo Professional
Posting times worked out from your own posts
Personalized time suggestions in the composer and a posting queue that fills its slots from each account's history. Professional is $29 a month for 15 accounts.
Frequently asked questions
Why can't I see Most active times on Instagram?
Two usual reasons: the account is set to personal, or it has fewer than 100 followers. Switch to a Creator or Business account in settings, and the chart appears under Total followers in the Professional dashboard once you pass 100 followers.
How many posts do I need before my own data beats a generic chart?
Around four posts per slot you're comparing, posted over a few weeks with the same format. Fewer than that and a single lucky post decides the result. If you post twice a week, that means testing two slots for about a month.
Should I post exactly when my followers are most active?
Usually a little before. Posting an hour or so ahead of the peak gives the post time to pick up its first engagement, so it's already moving when most of your followers open the app. Test the peak against the earlier slot rather than assuming.
Does posting time matter on TikTok if most views come from For You?
Less than on follower-led feeds, but it still affects the first hours, when TikTok decides whether to widen a video's reach. Test it like any other slot, and judge on views at a fixed age rather than total views weeks later.
Which metric should I compare when testing posting times?
Reach per post, or views for short video, measured at the same age for every post. Timing mostly changes who sees a post first, and reach is where that shows. Likes and comments depend more on the content itself.
How often should I re-check my best posting time?
Run one short test cycle every quarter, and another after a big change: a jump in followers, a new audience region, or a switch in format. A slot that won last spring can quietly stop winning without anything else looking wrong.